Inexpensive Country ETFs for Value Investors
The United States stock market has been on a bull run from March 2009 till February 2021 and is now expensive by certain valuation metrics.
Jeremy Grantham recently published a piece arguing that the US is in the late stages of a major bubble and investors should consider alternatives. His article was written in January 2021.
Other global stock markets have not performed well and are near 2009 financial crisis lows. ETFs make it easy to invest in index funds that offer broad diversification in these contries.
Shifting from highly valued US growth stocks to cheap international ETFs is one way to "sell high and buy low".
The magnitude of the reallocation should depend on the investors current allocation, long term investing goals, and risk tolerance as outlined in your Investment Policy Statement (IPS). If you don't have a formal IPS, you're sailing without a compass and will find it hard to navigate these choppy financial waters.
US growth, US bonds, and crypto are all arguably in bubble territory. Reallocating to cheap assets may limit bear market drawdowns.
Here are the 10 year expected equity returns by country per Research Affiliates.
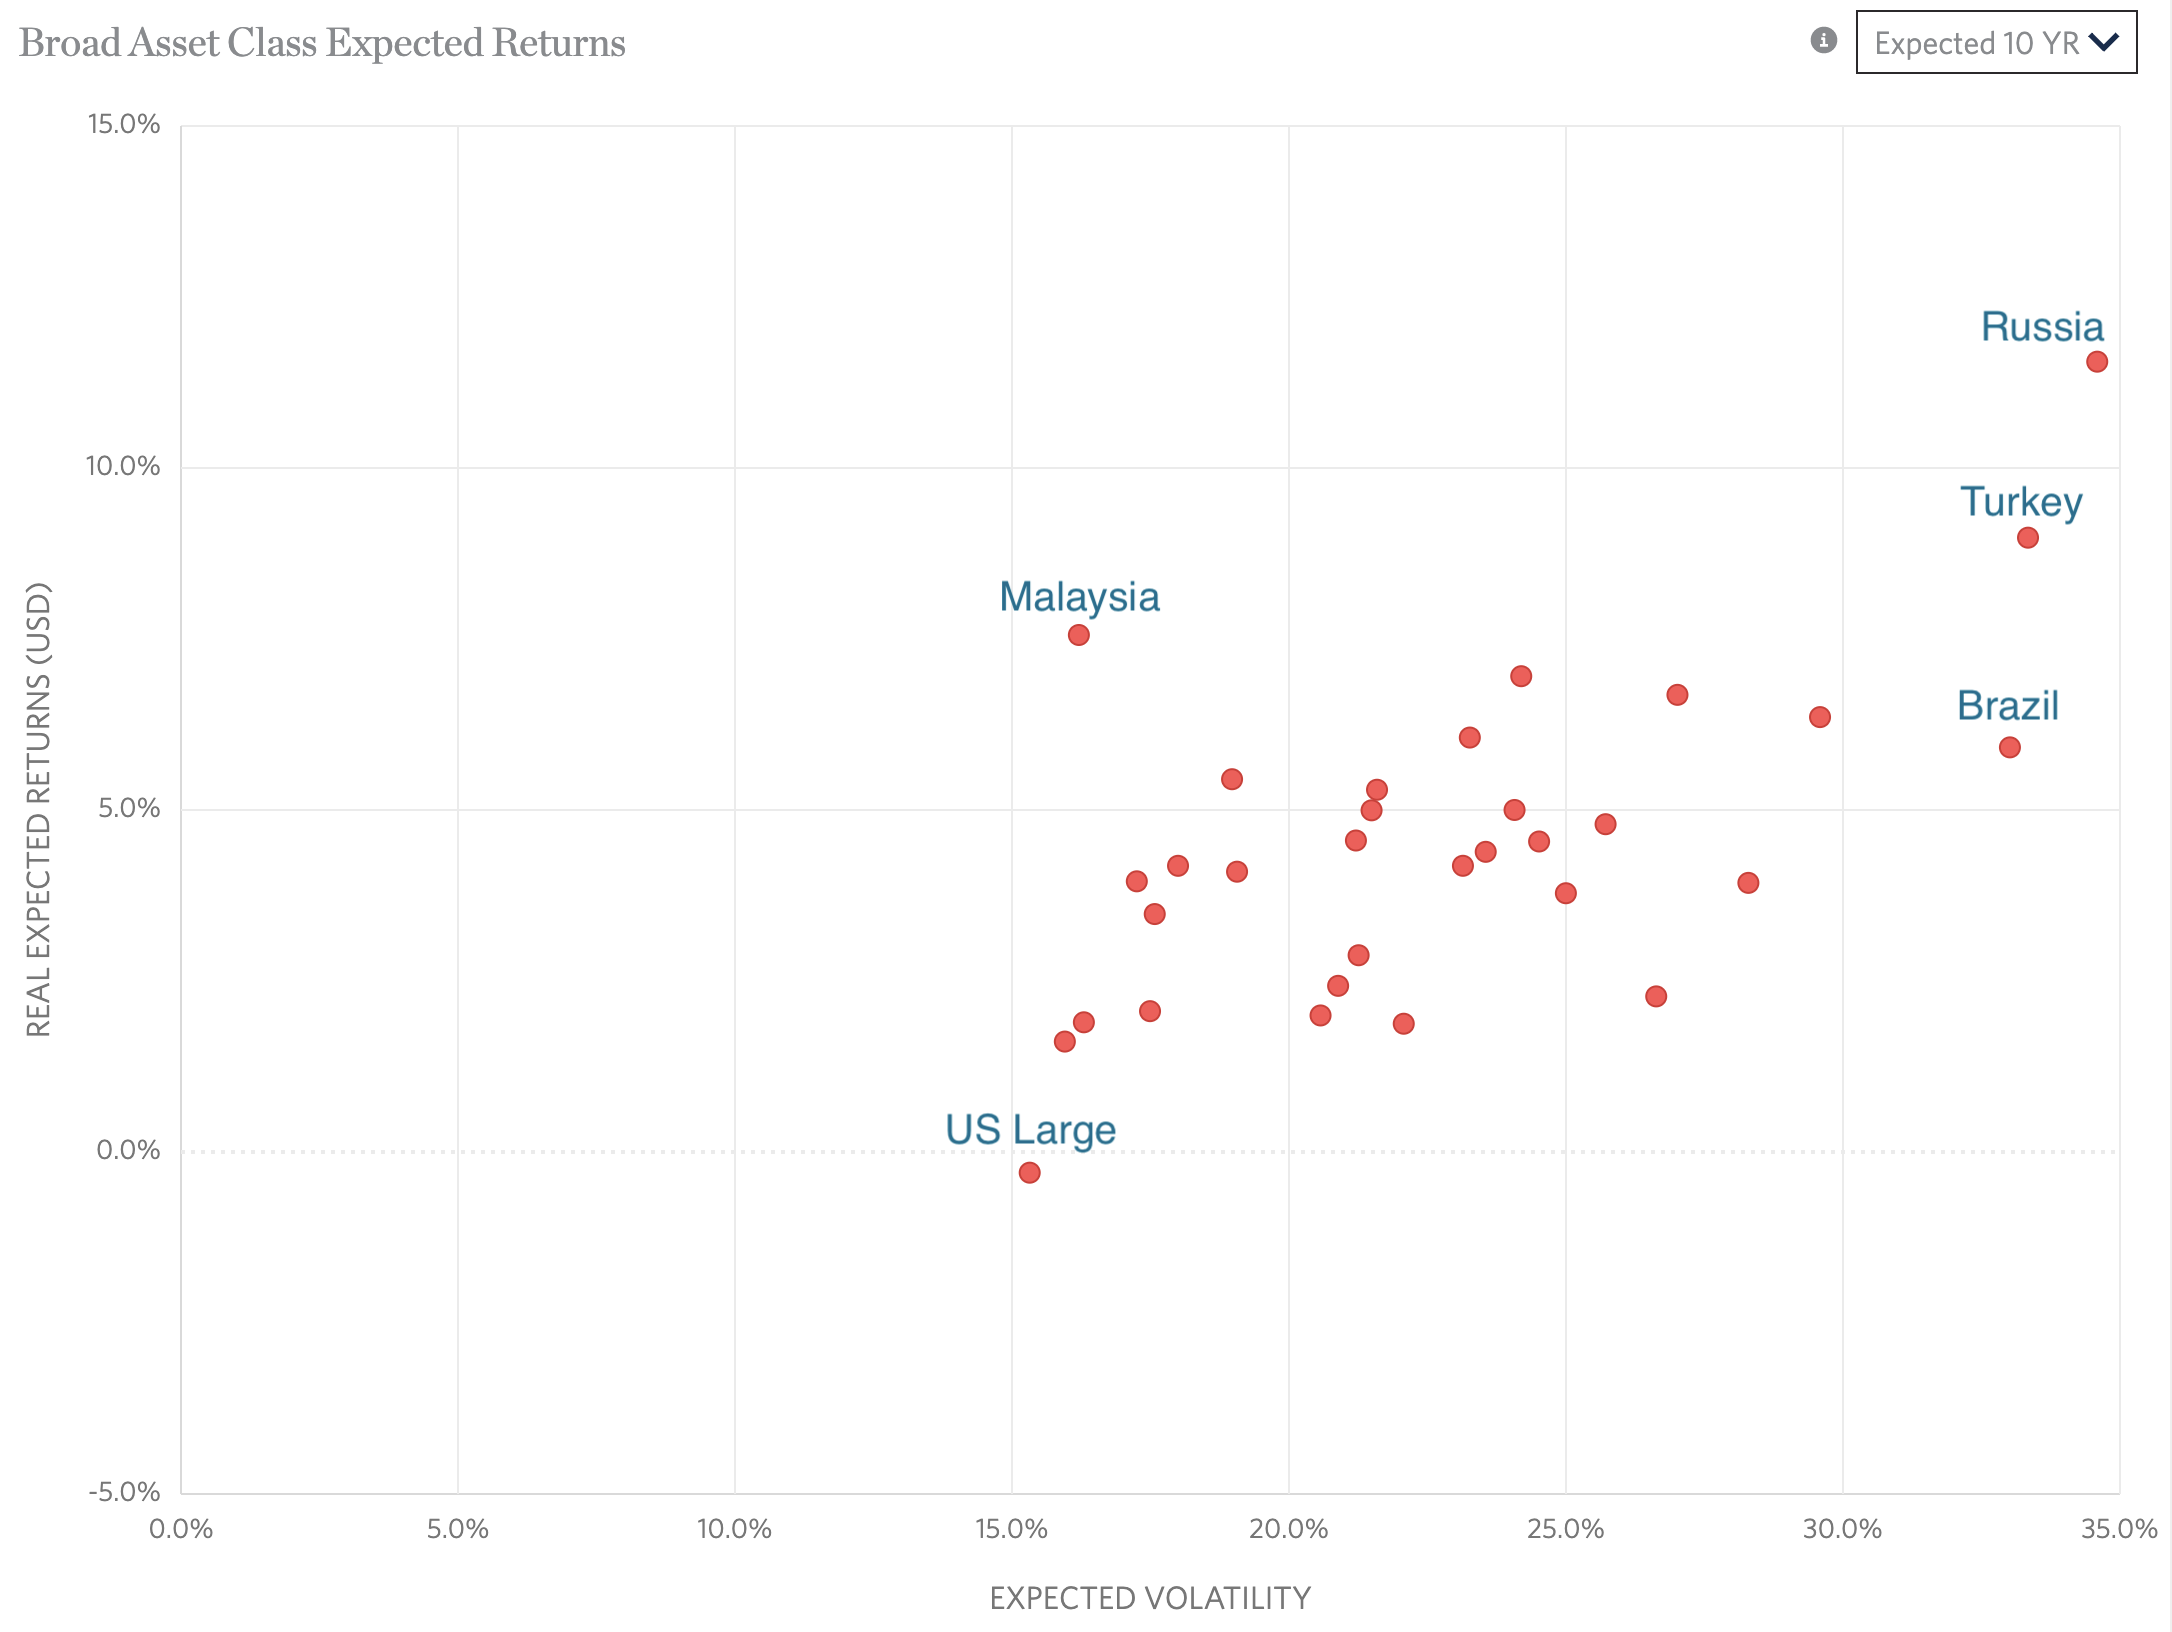
The rest of this blog post will dig into these specific equity markets:
- United States
- Colombia
- Russia
- Malaysia
S&P 500 performance
The S&P 500 index bottomed out at 666 in March 2009 and currently sits at 3,935.
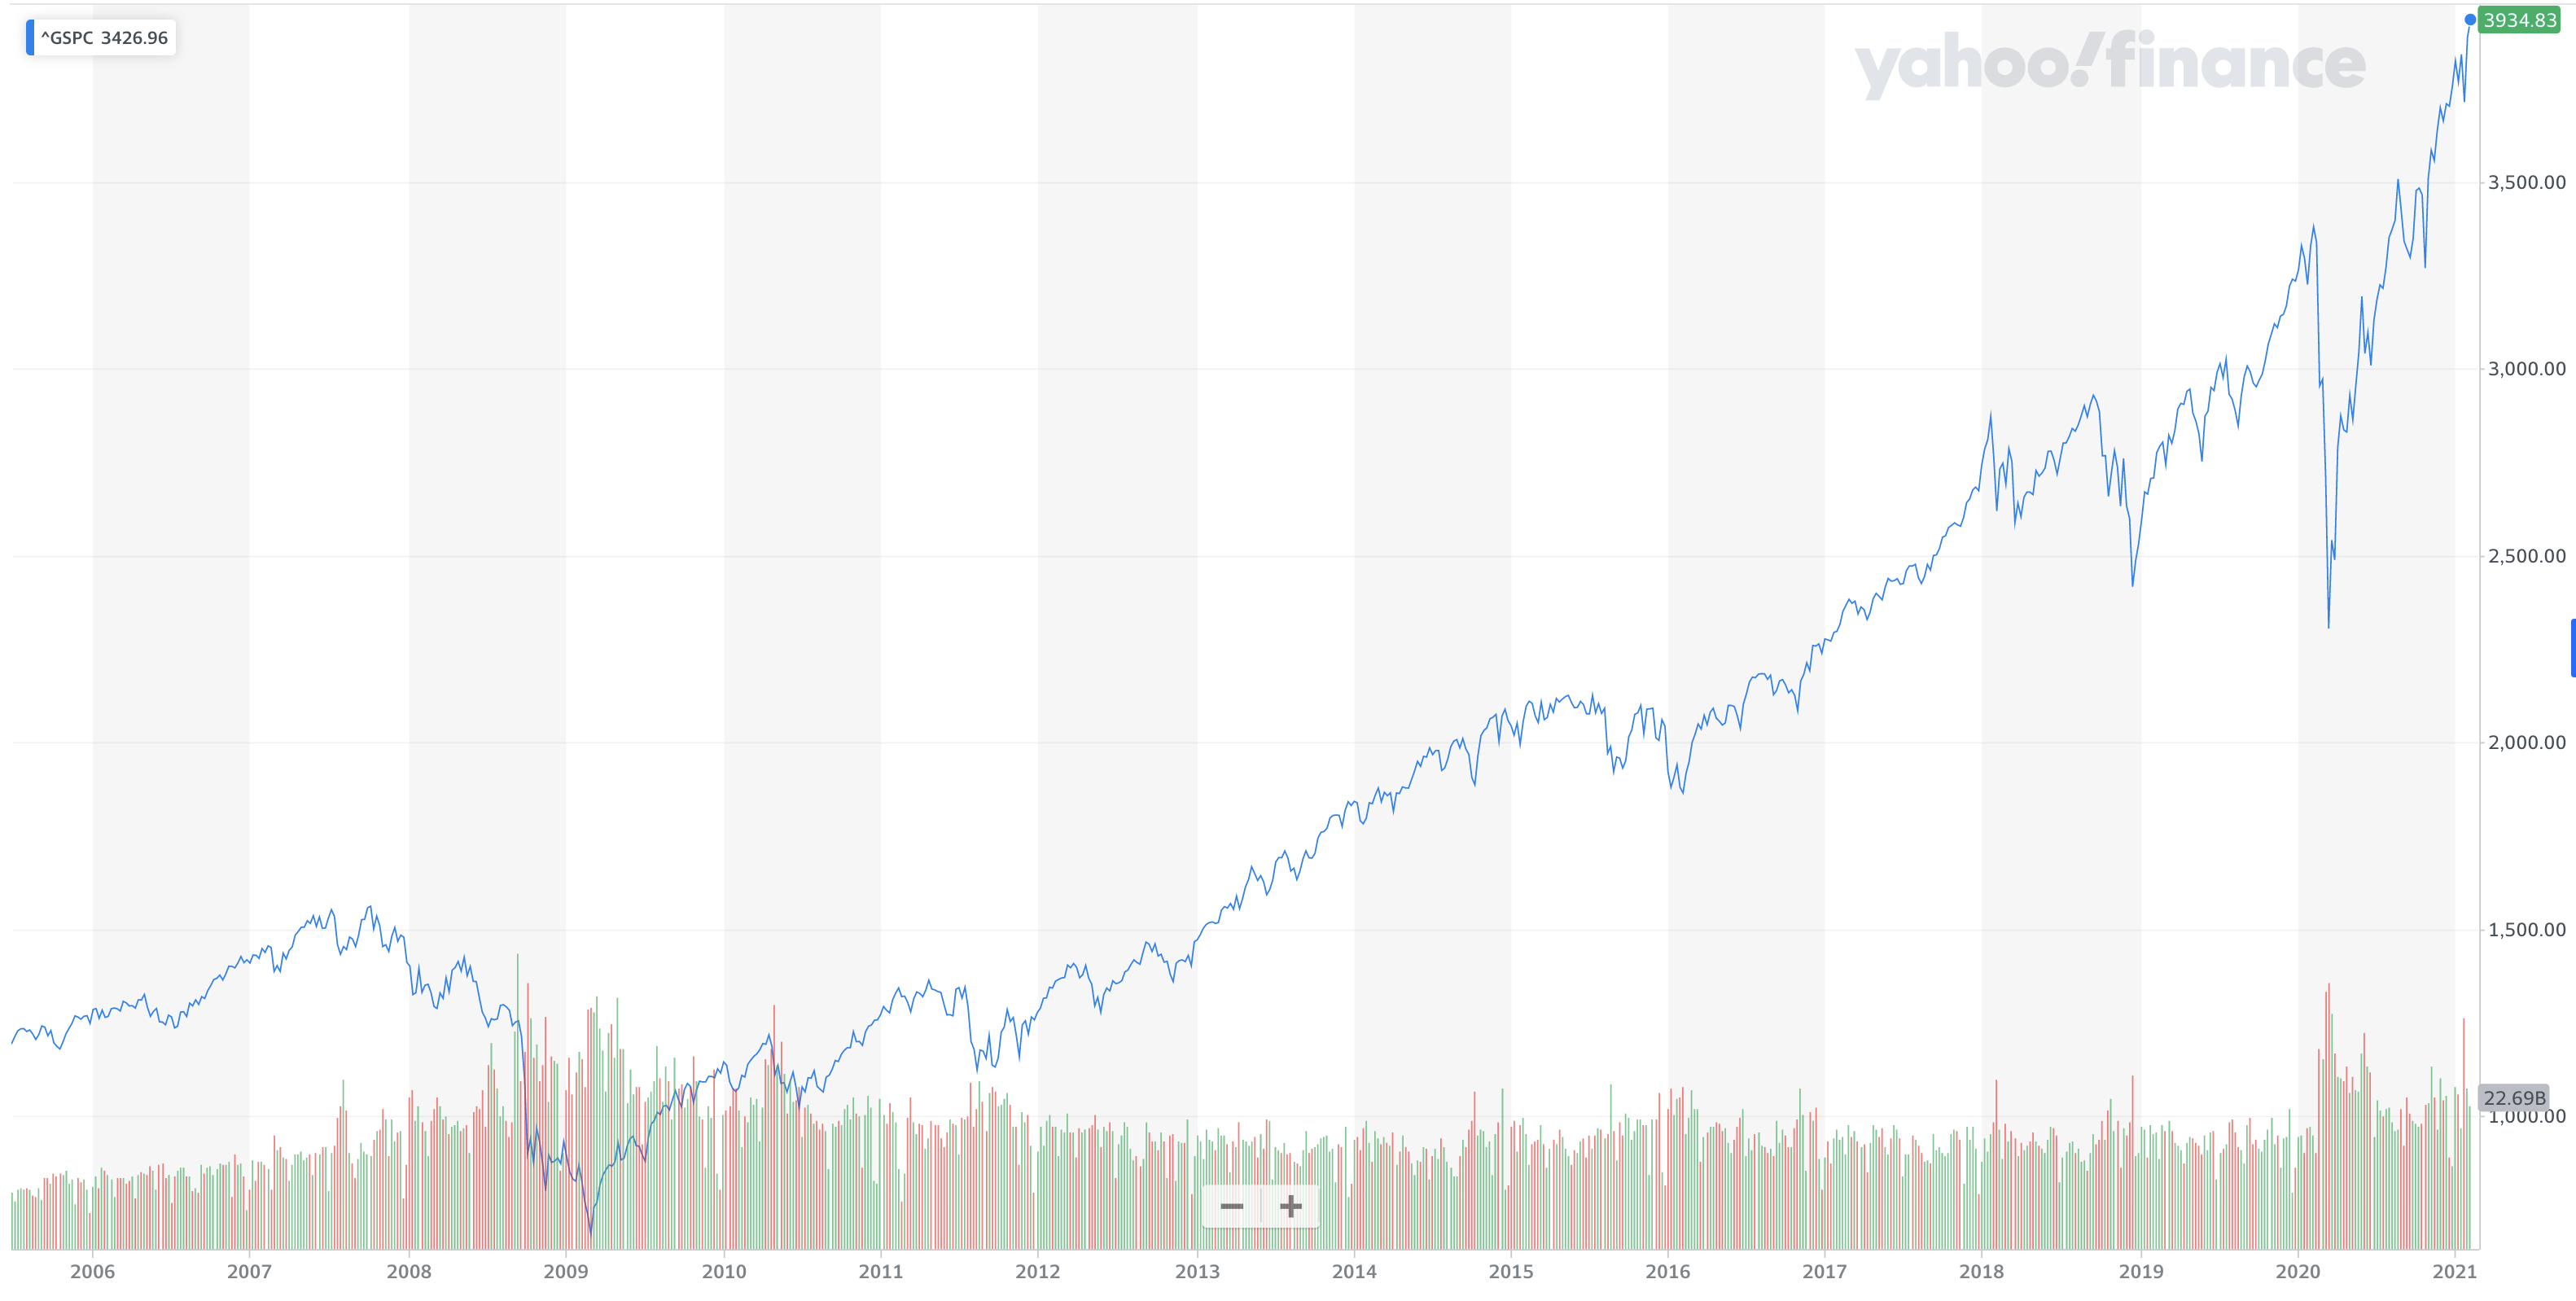
It's up 6x from the global financial crisis lows.
S&P 500 profits have not grown by 6x over the same time period. The price increases have been driven by multiple expansion (i.e. higher price to earnings ratios).
The multiple expansion may be justified because of low interest rates, or fiscal stimulus, or tons of liquidity. Assessing the fair valuation of the S&P 500 index given yields, profits, and market conditions is complex.
The S&P 500 index was downtrodden and low in the wake of the financial crisis. It was easy for Buffett to tell investors to Buy American in October 2008 when the S&P was around 950.
The long case for the S&P 500 index isn't as clear with the index around 4,000.
Let's look at some other markets around the world, which are currently unloved, just like the S&P 500 index back in 2009.
Colombian stocks
Colombia is a South American country of 50 million people with a growing economy. Take a look at a graph of the Colombian vs. US GDP growth from 2009 to 2019:
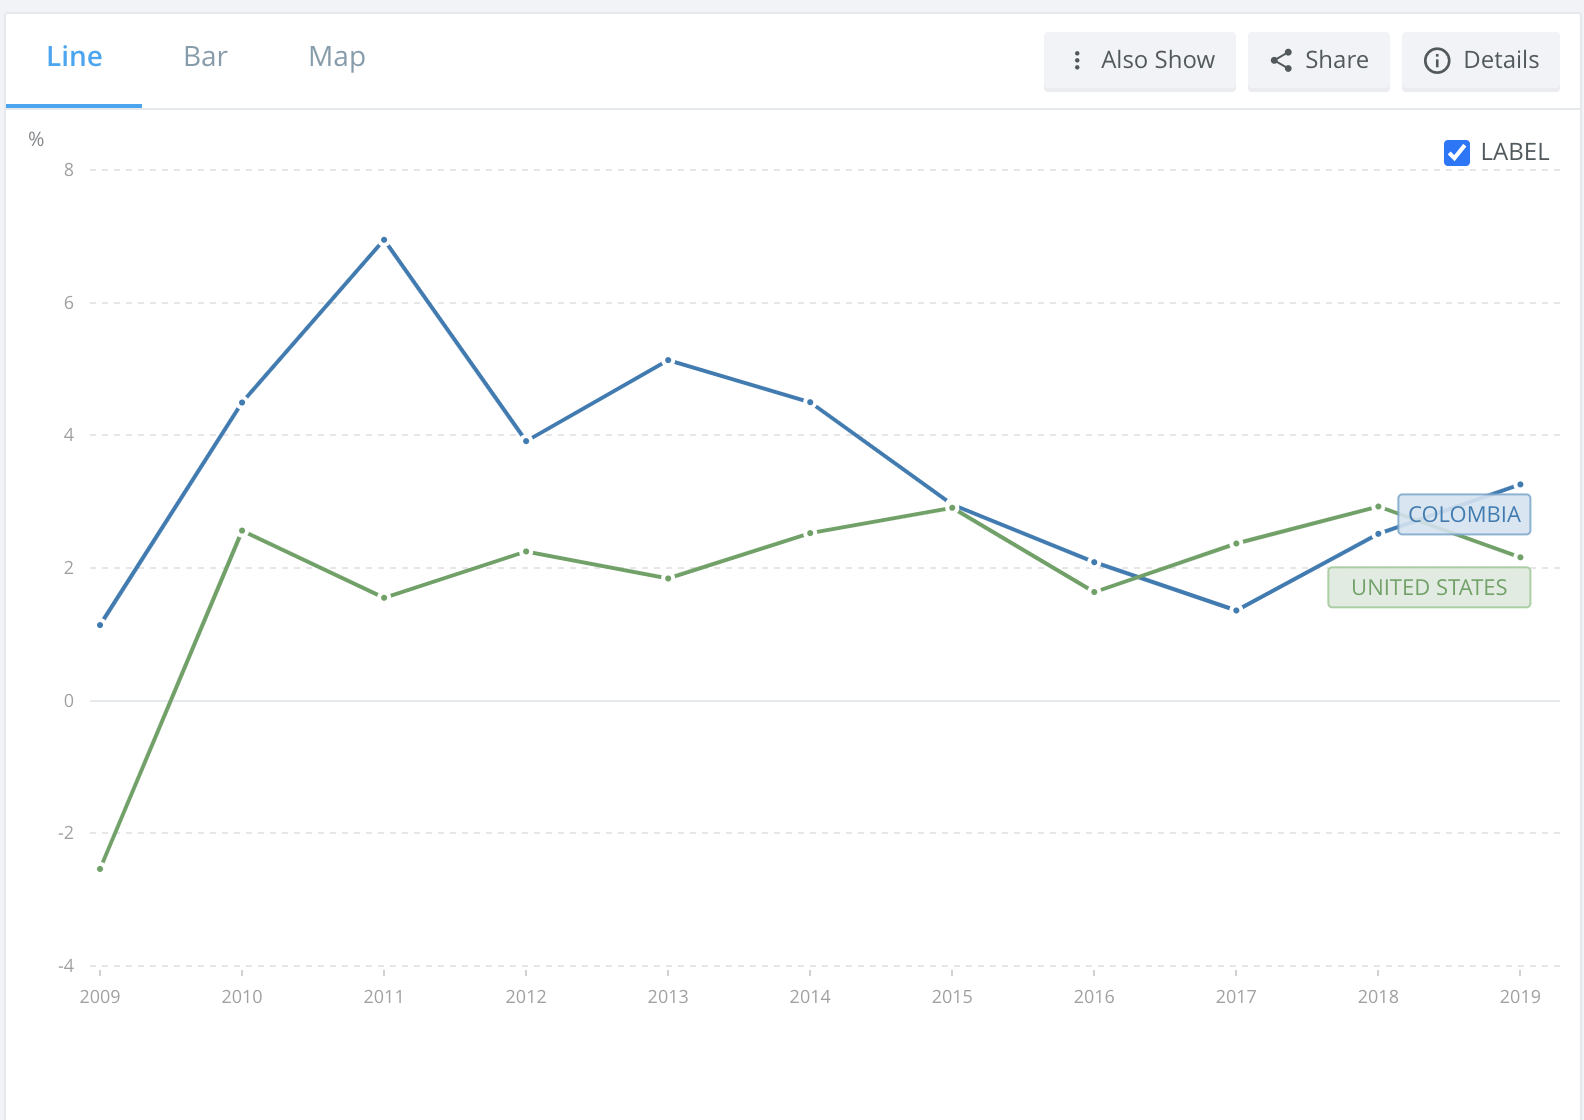
The Colombian GDP growth has outpaced US GDP growth almost every year for the last 10 years, but the Colombian stock market has been flat.
As of February 2021, the Global X MSCI Colombia ETF (GXG) fund is back to February 2009 levels.
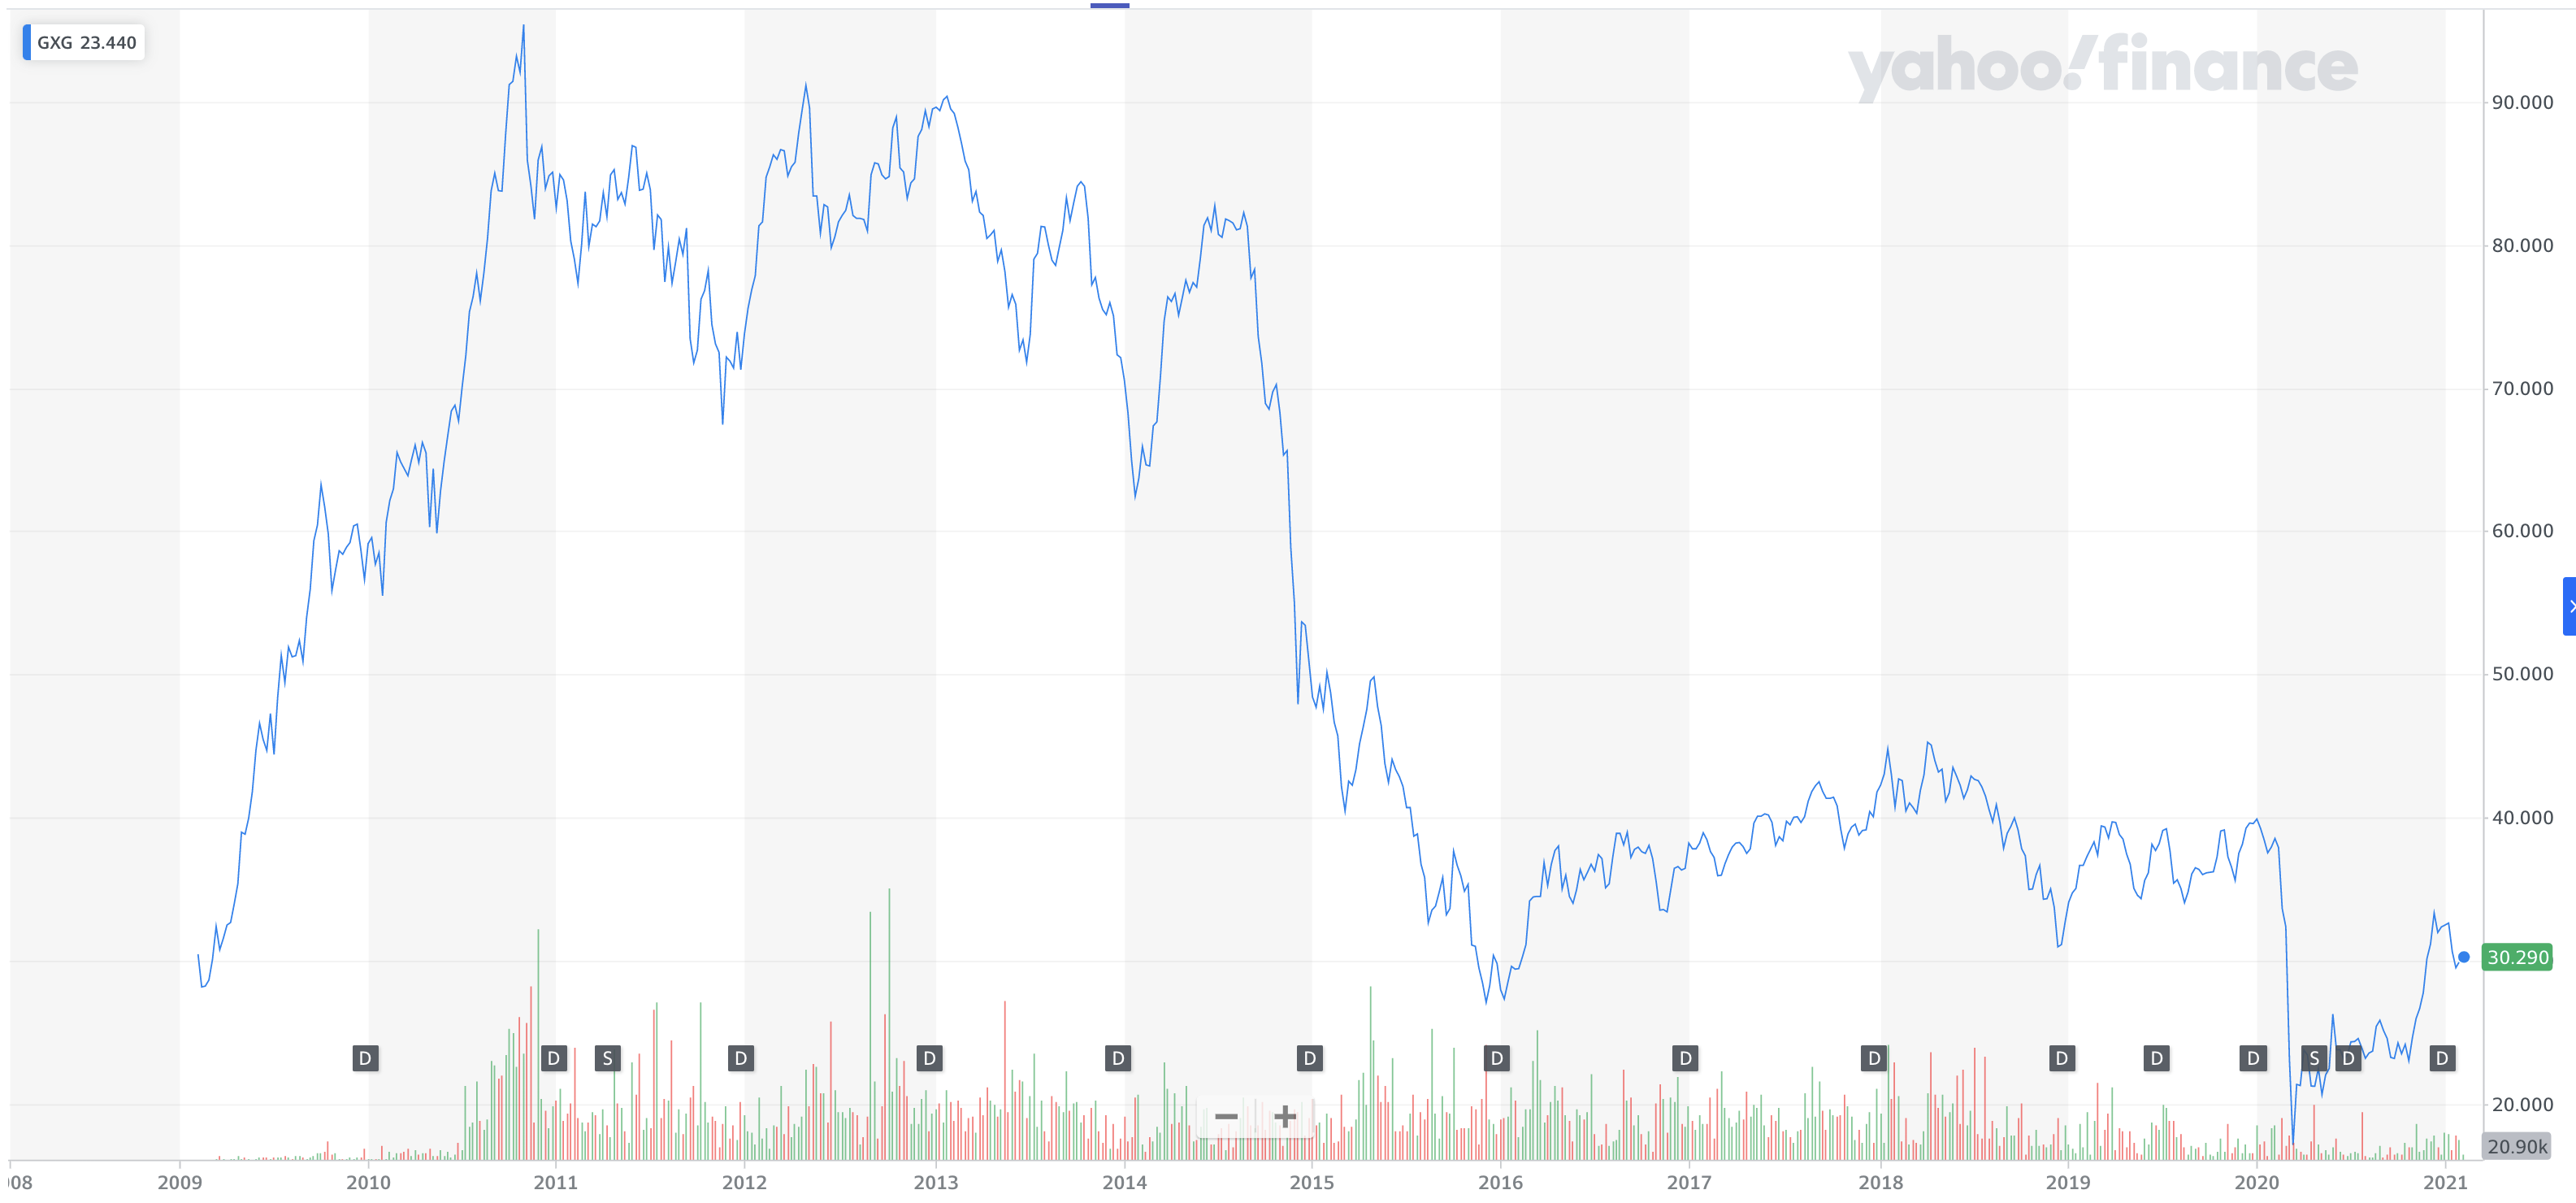
The US dollar has strengthened significantly against the Colombian peso over the last 10 years, which has been a drag on GXG returns.
GXG is mainly invested in financial (49%), energy (17%), and utilities (17%), sectors which haven't done well.
The underlying companies that compose the index (e.g. Bancolombia and Ecopetrol) are big, profitable companies that are traded on American stock exchanges.
The fund is paying a solid 2.9% dividend yield.
As of December 31, 2020, the GXG 10 year average return is an abysmal -7% annually. Compare that with a 13.5% annual return on the S&P 500 index for the last 10 years.
GXG has underperformed massively compared to US equities and that's why it's so cheap right now.
I'm optimistic about the future of Colombia and think it'll continue to grow faster than the United States. Big economies need to innovate to grow. Developing markets can grow simply by replicating proven advanced economy businesses in local markets. Colombia's growth should result in higher corporate profits.
I'm long GXG. I'm also biased in favor of Colombia. Have lived here for most of the last 6 years and it's an amazing country that's filled with cool people. Hard to be anything but optimistic about such an incredible place.
Russia
The iShares MSCI Russia ETF (ERUS) fund invests in a variety of Russian equities.
The 10 year annual return has been 0.55% and the fund is well off its April 2011 peak.
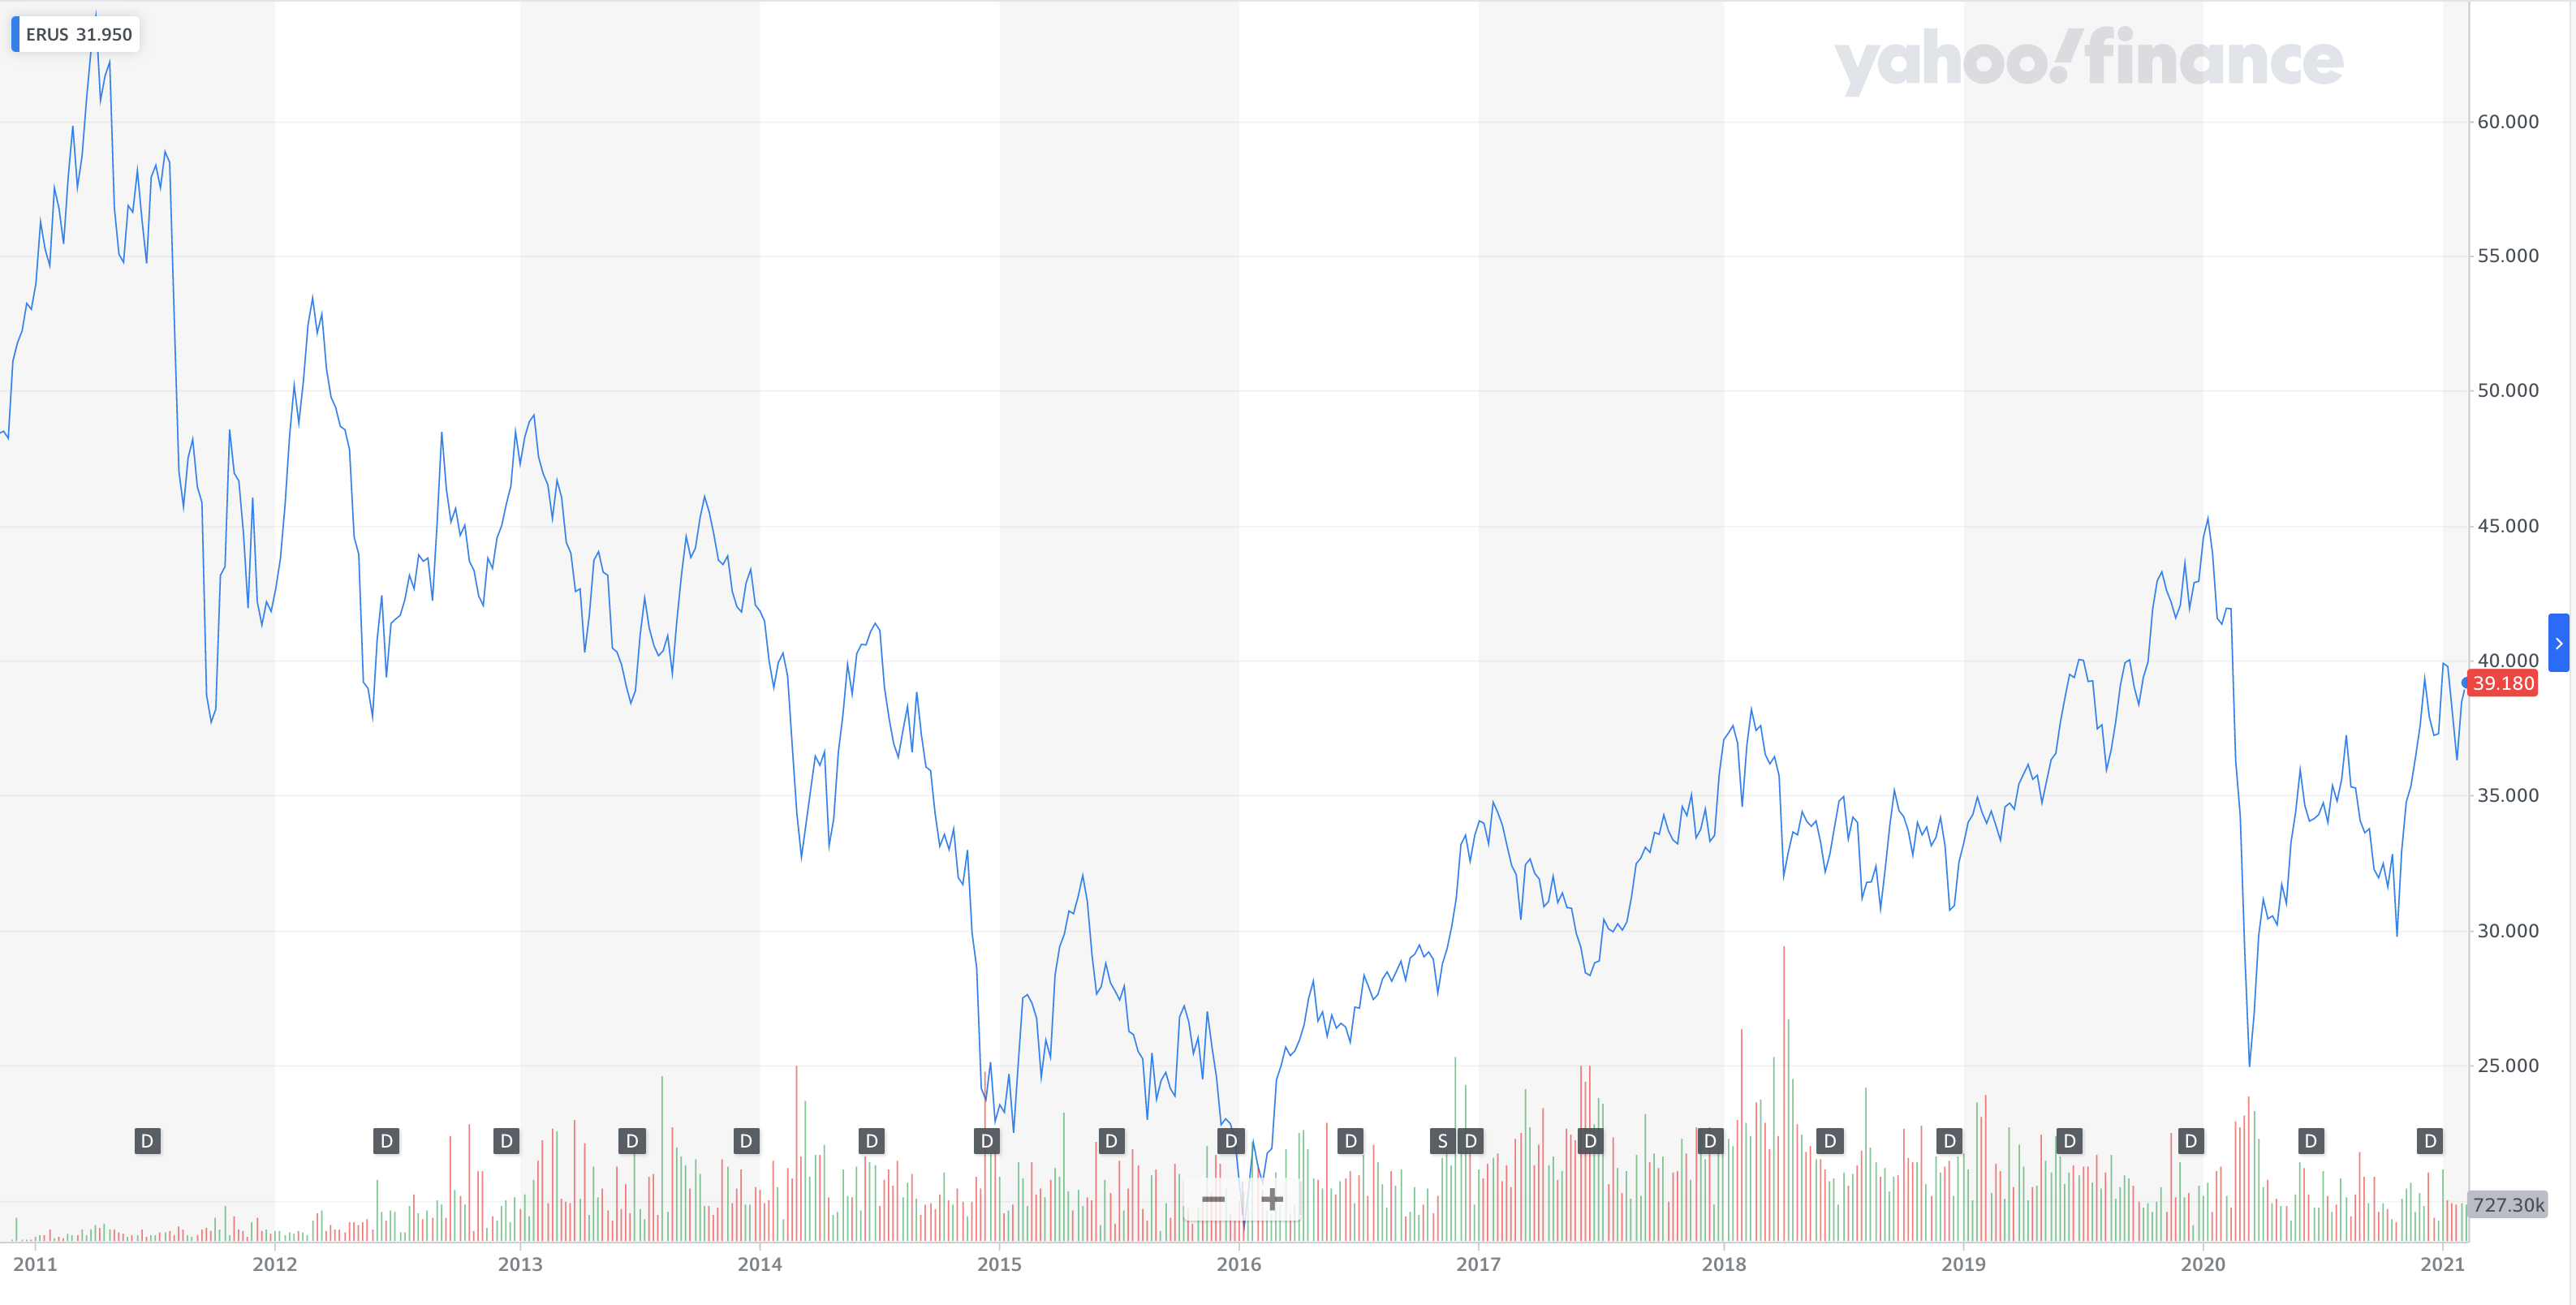
The fund in mainly invested in the energy (43%), materials (21%), financial (17%) and communication (12%) sectors.
It pays a hefty 4% dividend yield.
The biggest company in the index is called Gazprom. A simple Google search should quell any fears of investing in a foreign land.
It's obvious Russian companies are making money. How do you think they built a $1.4 billion dollar palace?
In all seriousness, Gazprom is the largest supplier of natural gas to Europe. It prints money every year.
I'm long ERUS.
Malaysia
The iShares MSCI Malaysia ETF (EMW) invests in the biggest Malaysian companies like Malayan Banking and Tenaga Nasional. Malayan Banking made $2 billion in profit last year. It is a big, profitable company.
The index is 32% financials, 16% health care, and 14% consumer staples.
The 10-year annual return is -0.3% and the dividend yield is 2.8%.
Let's look at yet another stock graph (sick of these yet?):
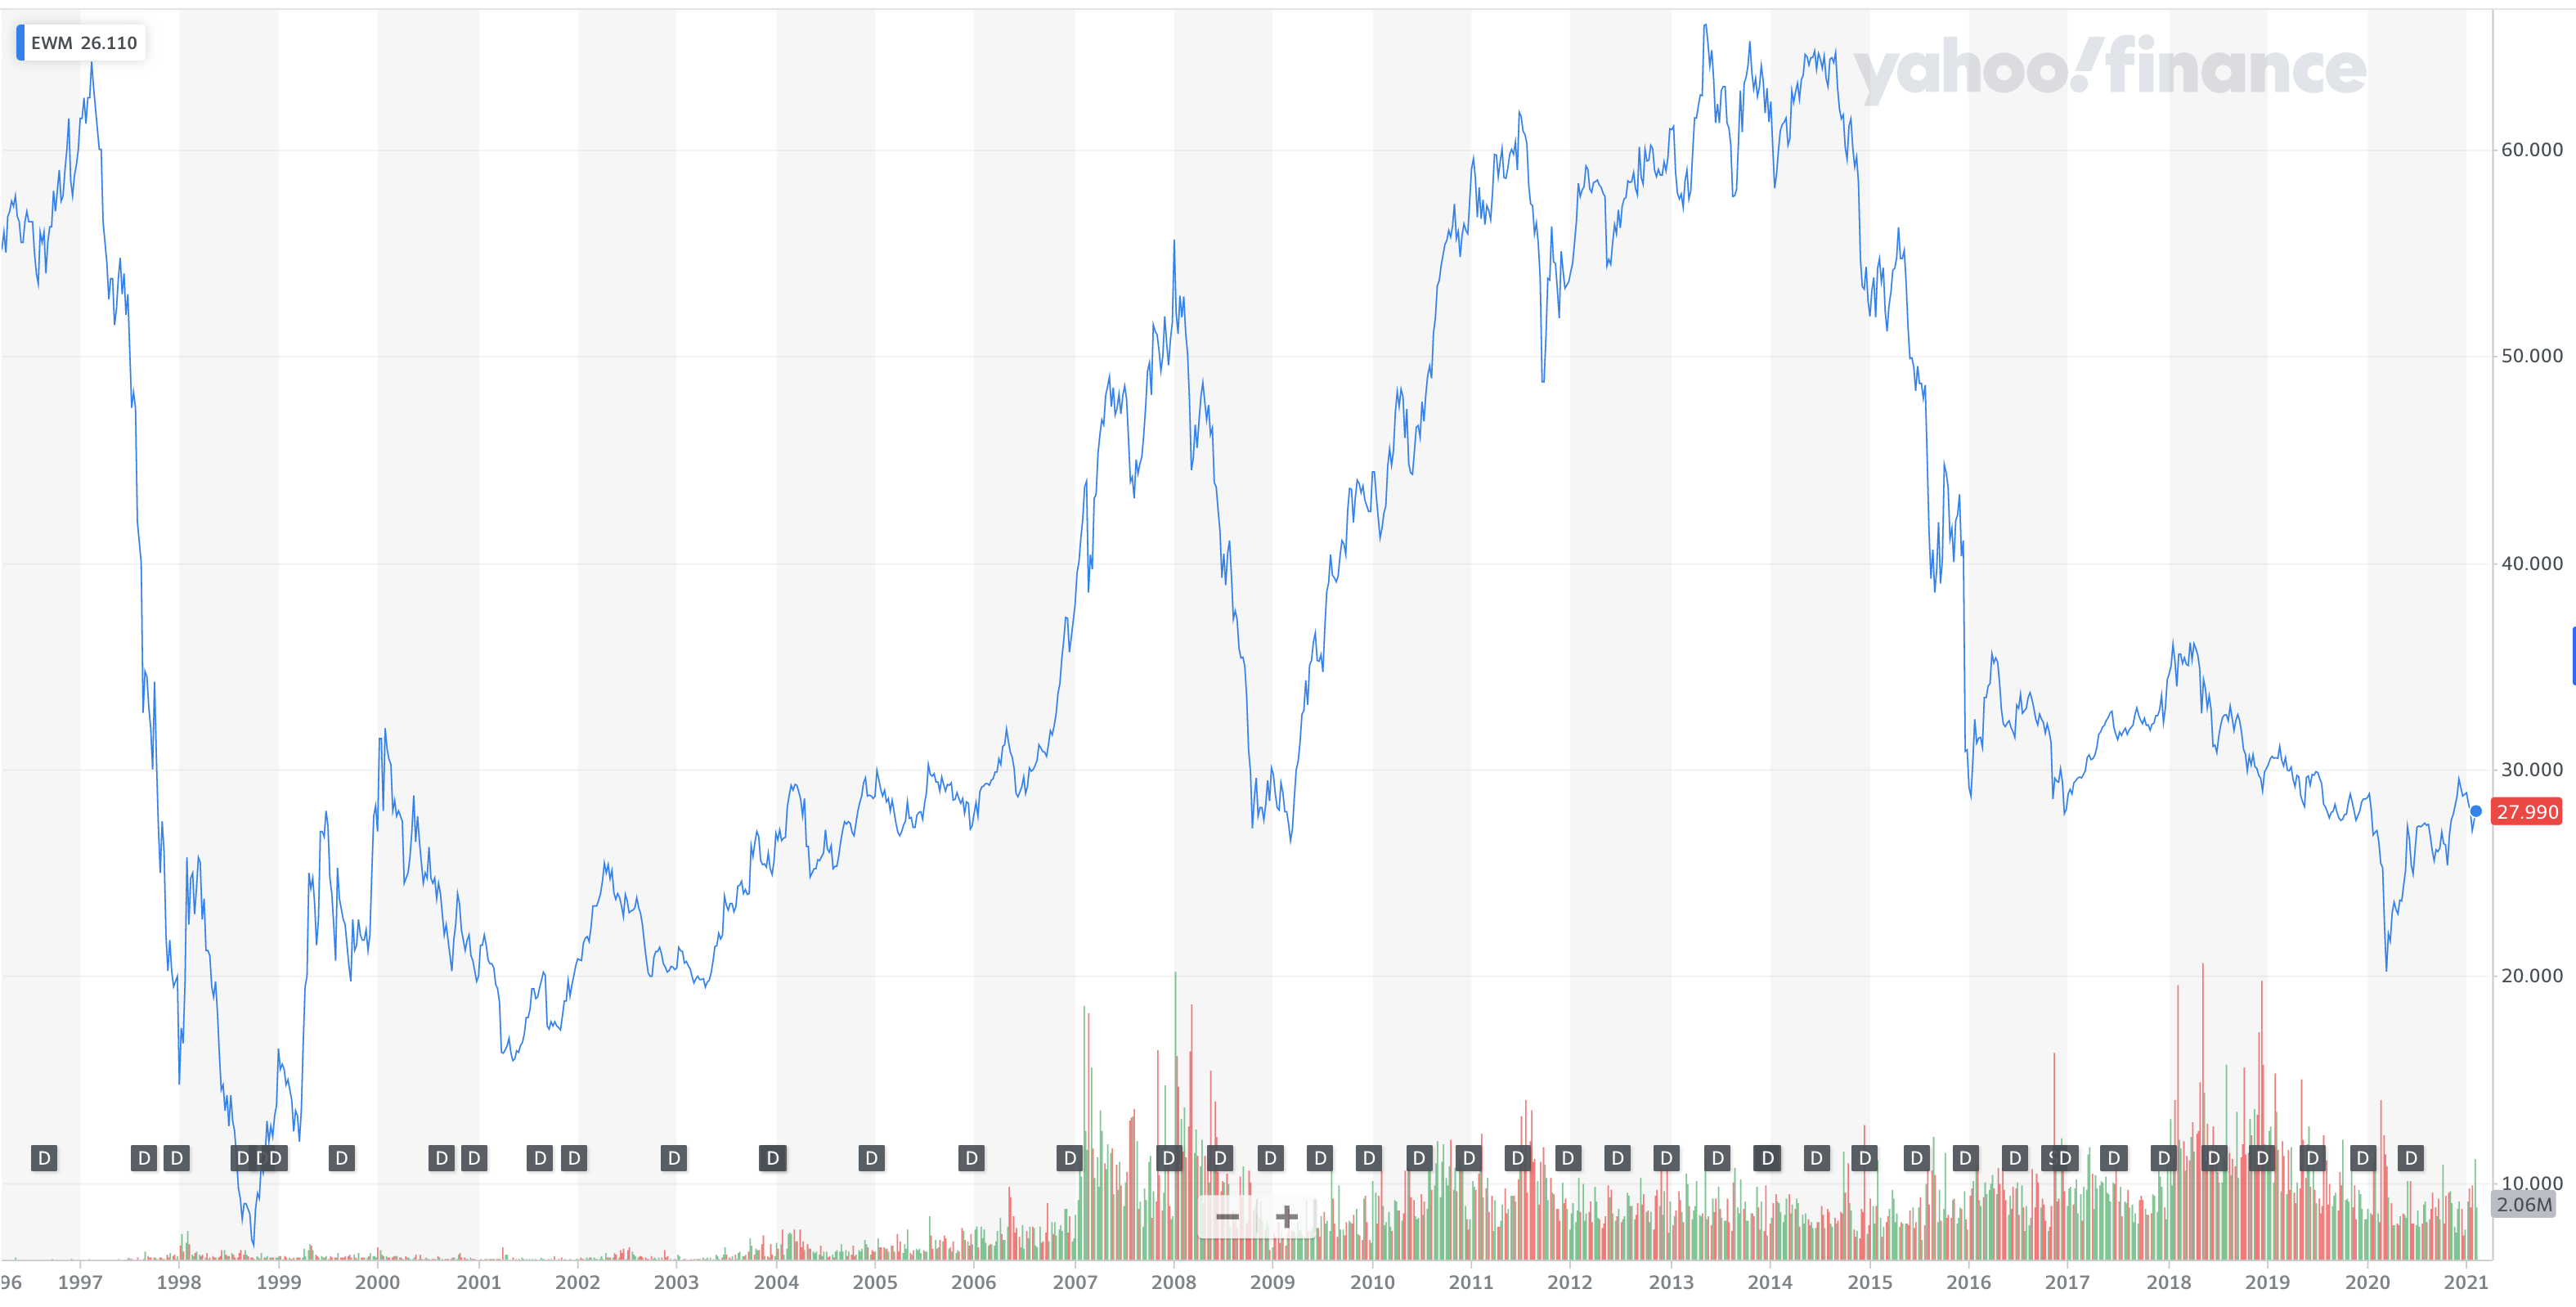
The price history for this graph starts in March 1996, earlier than the other graphs.
The Malaysian stock market crashed in 1997, along with several other Southeast Asian countries, in the Asian financial crisis.
It crashed again in the global financial crisis of 2008 and faced another sharp downturn starting in 2014.
You wouldn't think Malaysia was doing so well economically from looking at the stock graph but their GDP growth graph tells a different story:
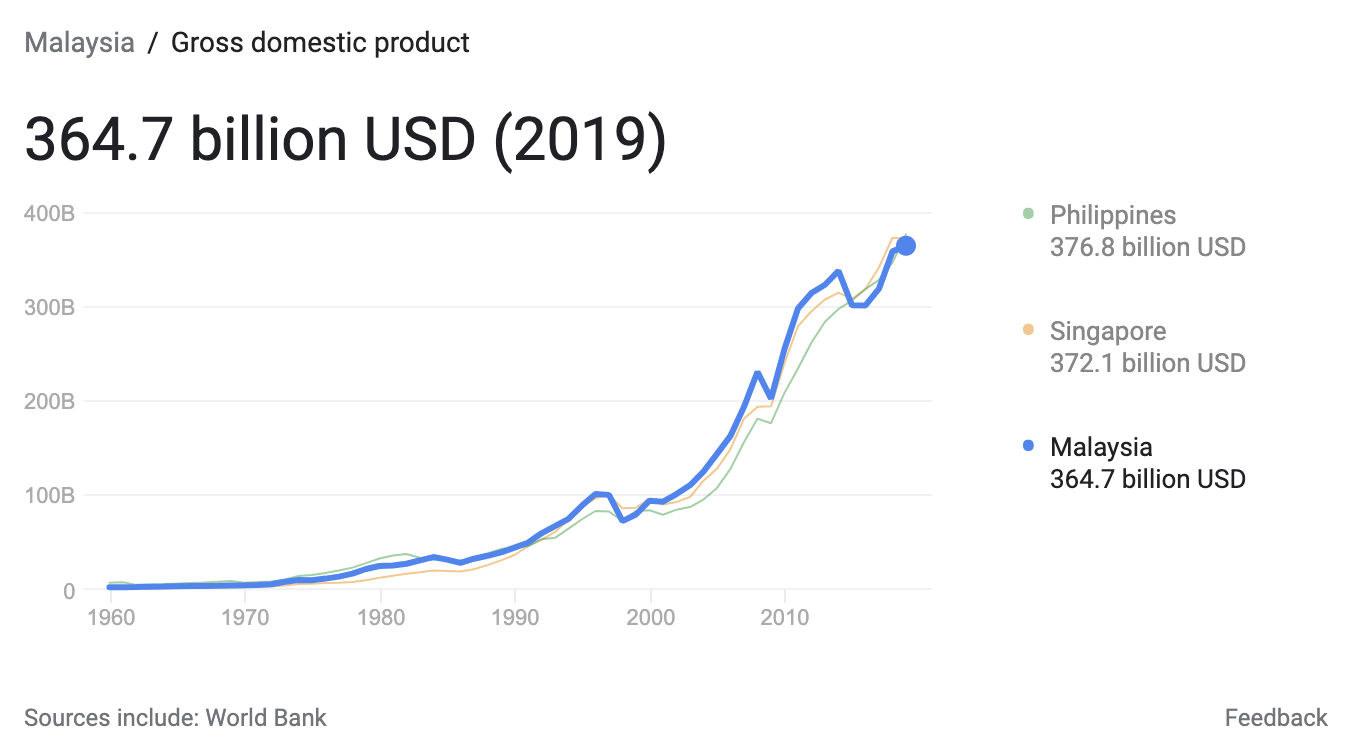
I'm not sure why a rapidly growing economy, backed by big profitable companies, has an index fund that's sitting below 1996 levels.
I was in Kuala Lumpur for a week in 2014 and loved it. It's a modern city with great food and nice people.
Understanding valuation differences
Datadog is a good example of a US growth stock. It has a market cap of $34 billion, TTM revenue of $0.5 billion, and no profit.
Bancolombia, the biggest component of the Colombia ETF, has a market cap of $8.8 billion, TTM revenue of $4.5 billion, and profit of $0.9 billion.
Tenaga Nasional has a market cap of $14.2 billion, TTM revenue of $11.7 billion, and profit of $0.8 billion.
US growth companies have bigger market caps, but don't necessarily have bigger businesses than the foreign companies in the indexes this blog post has covered. Malaysia is a big $365 billion dollar economy. It has a bunch of big companies.
If Datadog grows and starts making 10 billion in profit a year, the stock price will continue rising and it's a great buy. If it only makes 500 million in profit a year, then it'll probably go down. $34 billion market caps need to be backed by big profitable enterprises in the long run.
Assessing Bancolombia is different. It's an established business that's already making a profit.
Conclusion
The US has performed very strongly for the past 10 years and is highly priced according to several valuation metrics.
Certain international markets are at or near all-time lows.
Returns on international markets have been dragged down over the last 10 years as the dollar has strengthened. A weakening dollar would be a tailwind for these funds.
Some of these battered stock markets are in countries with rapidly growing economies. I've lived in Medellin, Colombia for most of the last 6 years and the local economy is booming. Foreigners are buying apartments and opening businesses here. Massive apartment buildings are being constructed all over the city. They recently finished a project to build a massive tunnel through a mountain to make it quicker to cut the airport trip time from 45 minutes to 18 minutes.
Yes, Colombia has political risk, but so does America.
You can lock in US stock market profits and reallocate funds to under-priced international markets. Lots of asset classes are highly valued, but some are still really cheap.